Making Sure You Get the Full Picture
Debunking the Police, Part 3
Written by Craig Sloss, Edited by Fitsum Areguy
When someone uses statistics to argue for more money, it's important to consider whether they’re telling the whole story. The Waterloo Regional Police Services (WRPS) provided data showing crime rates going up—and only up—between 2021 and 2022 to support their request for an $18.3M budget increase in 2023. However, we should question if this data is complete and if it truly justifies their funding request.
Introduction
Welcome to the third newsletter in a series of six, inspired by my Twitter threads leading up to a vote on the WRPS’ budget earlier this year. In the previous issue, we discussed the following table from Appendix C of the WRPS budget justification memo titled "Crime Trends in Waterloo Region from 2021-2022 (WRPS)":
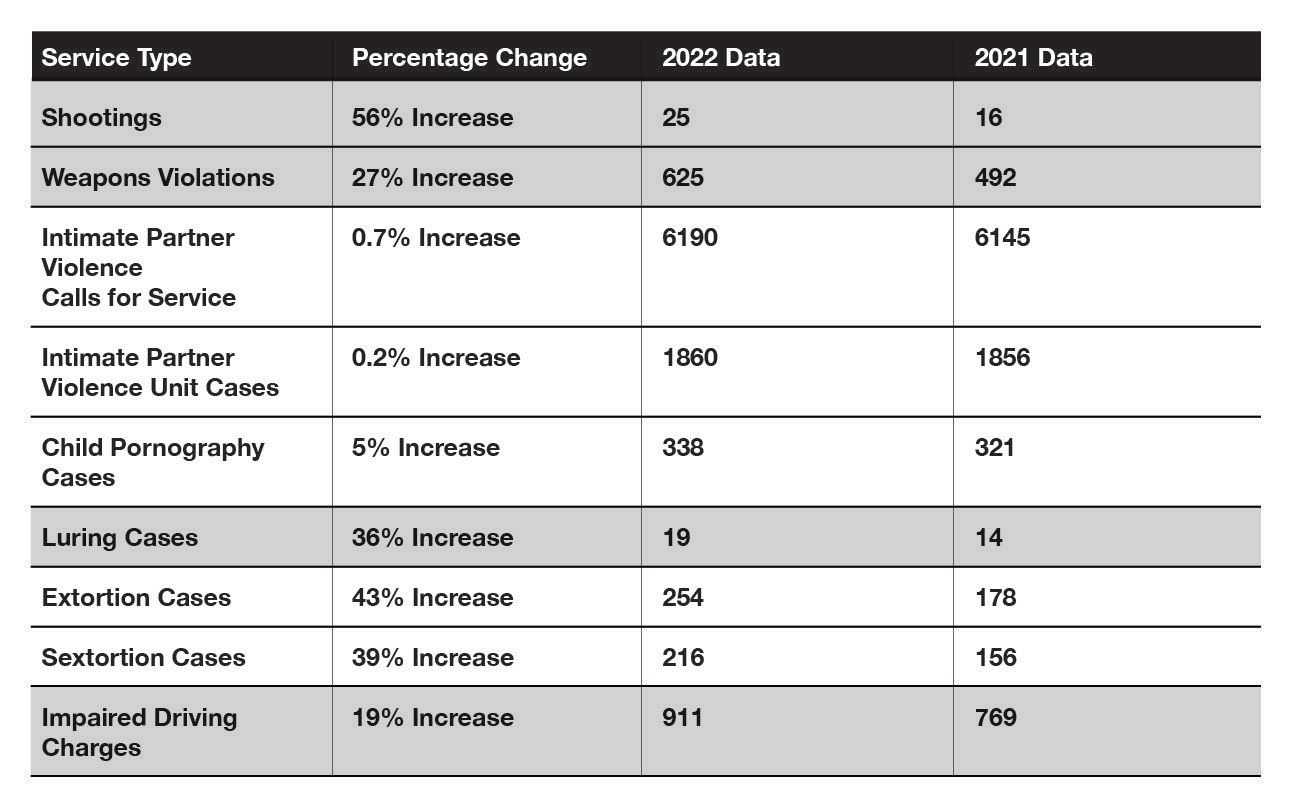
Last time, we explained why it's not possible to prove a "trend" using only two data points. By including additional data points, we discovered that either these so-called trends didn't exist, or if they did, they were exaggerated.
But let's not overlook another peculiar aspect of this table. Did you notice that the reported rates for these crime types all increased between 2021-2022? None of them decreased. Considering the wide range of crime types available in the data, the analyst had to make choices about which ones to include in this summary table. As we discussed earlier, such choices introduce subjectivity into the conclusions. By selecting only crime types with increasing reports, the table reflects a subjective viewpoint that crime is worsening.
In this article, we'll examine data from Statistics Canada’s Uniform Crime Reporting (UCR) Survey. Using data from 2021 and earlier to provide additional context to the WRPS’ 2022 numbers, we can explore the frequency of crime rate decreases and the implausibility of having a year with only increases. This suggests that WRPS deliberately omitted crime types with decreasing reported rates, offering an incomplete and misleading representation in their budget submission to the Waterloo Regional Council.
Note: At the time of the original Twitter threads, UCR data was only available up to 2021. The data for 2022 were publicly released on July 27, 2023, but to maintain consistency with the earlier analysis we will only use data prior to 2021 to analyze trends. However, we will now be able to use the 2022 data to confirm that the conclusions based on pre-2022 data have largely held up in 2022.
How often do crime rates increase or decrease?
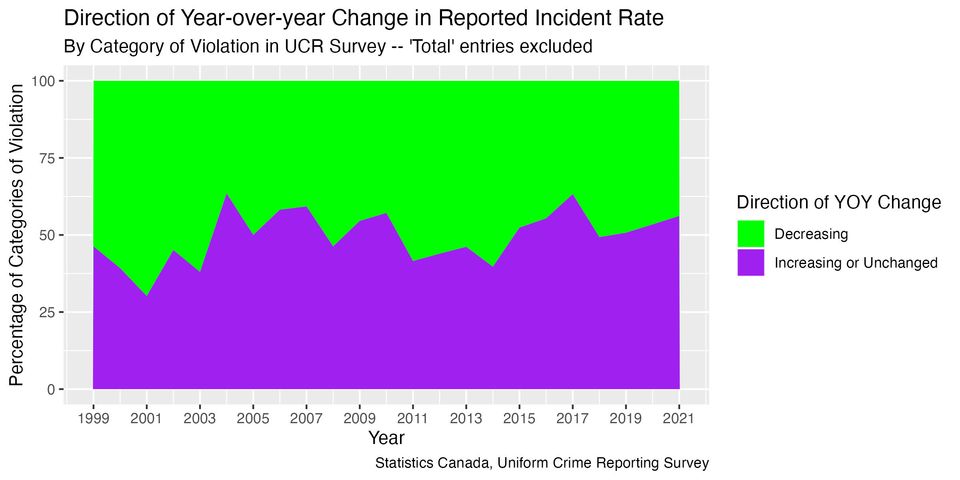
The UCR survey contains year-over-year percentage changes on reported rates for a wide range of types of violations. We can examine each year and determine how many violation types experienced an increase or decrease in the report rate. This analysis only considers the direction of the change, not the size. What we see is that between 35%-70% of violation types experienced a decrease in any given year.
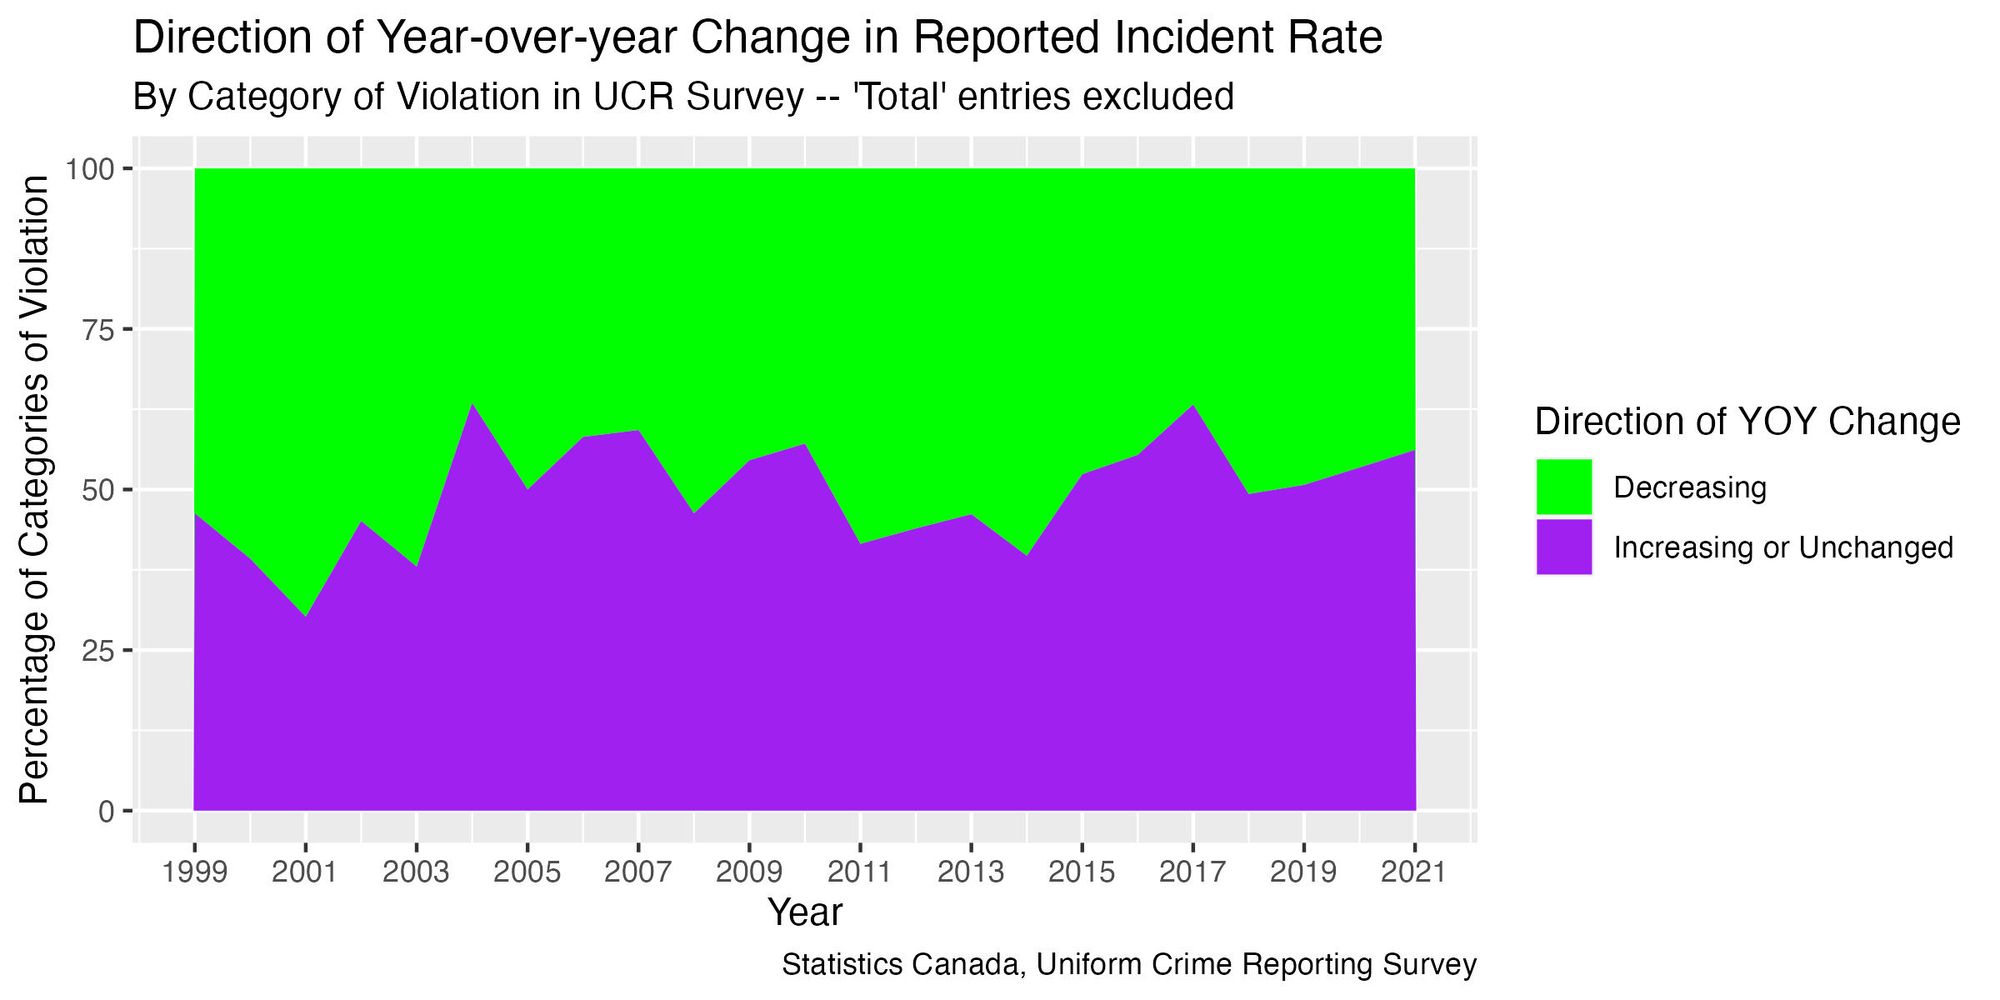
The fact that year-over-year decreases in individual types of incidents were so common in the time period between 2015 and 2021 is what makes me question why the WRPS memo only listed types of incidents that saw an increase between 2021 and 2022, and none that had a decrease.
Looking at the UCR data, we can easily find examples of types of crimes that decreased between 2020 and 2021, some of which are either cited as increasing types of crimes in 2022, or not are mentioned at all, in the WRPS memo:
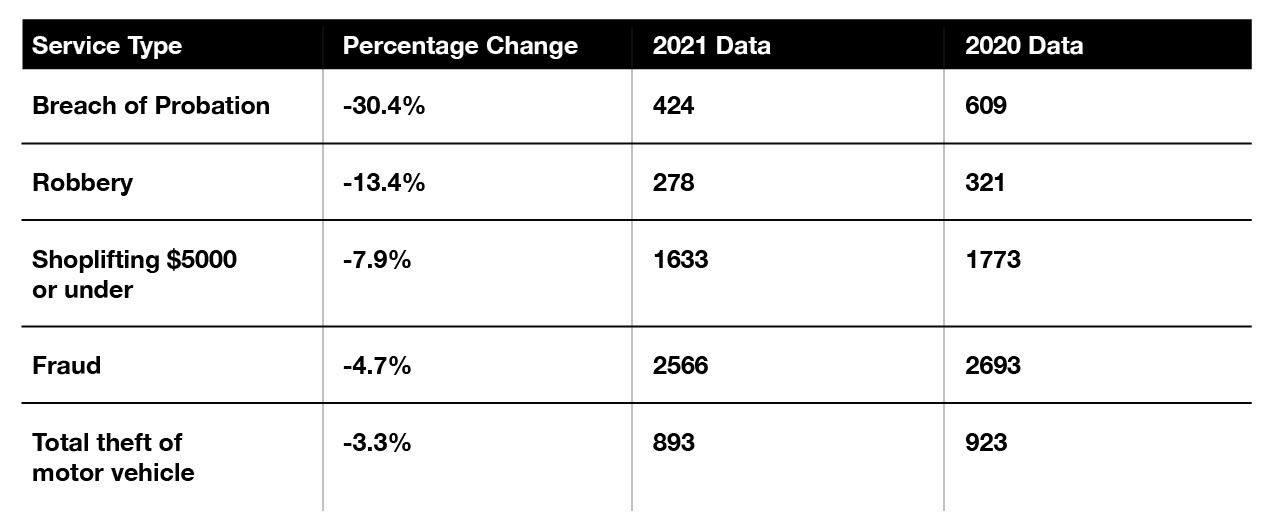
As we saw in the previous issue, a single year-over-year decrease isn’t enough to conclude that these are trending downward. What we’re seeing is that on top of the methodology used by WRPS being an inappropriate way to analyze trends, it’s not even being applied consistently.
When we do analyze trends over multiple years of data, we find that some of the year-over-year decreases in 2020-2021 are part of a longer-term decreasing trend—in the previous issue we saw that this was the case for Theft under $5000. When we dive deeper, we also see the same for Breach of Probation:
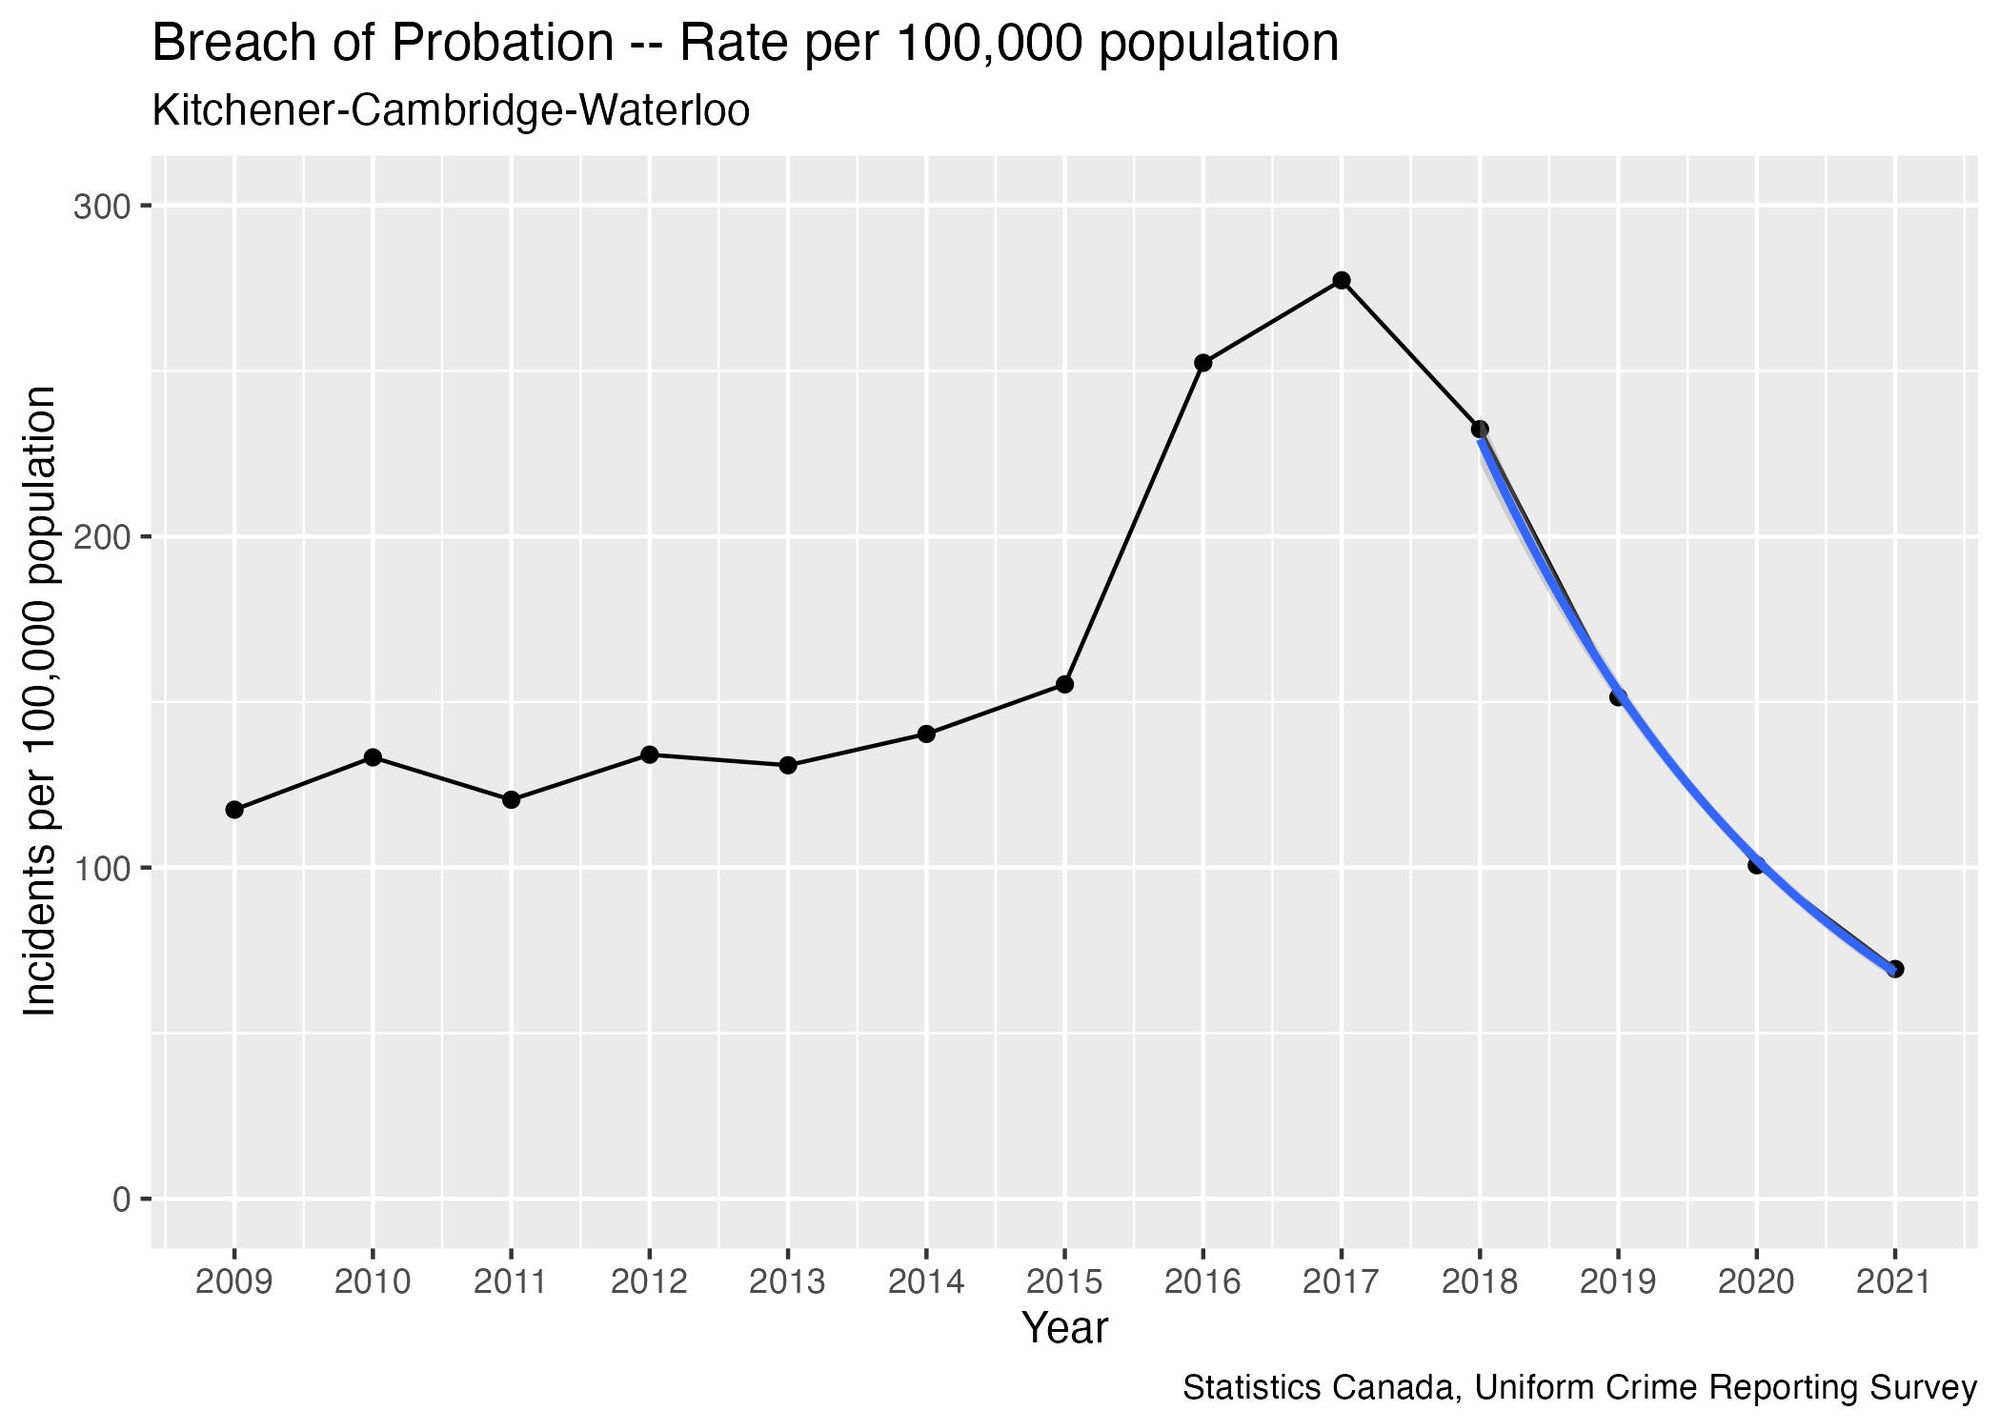
This type of violation has seen consistent year-over-year decreases since 2017, and fitting a trend line to the four most recent years, shown in blue, gives a very good fit, corresponding to a 33% decrease each year. In 2022, the rate was 75.1, suggesting that this may be starting to flatten out rather than continuing to decrease.
Selective reporting of changes in crime rates in a memo arguing for a budget increase can result in perpetually increasing police budgets, if Regional Council decides to increase budgets on the grounds that reported crime rates have increased, but never decreases the budget when rates decrease. Selective reporting suppresses the information that would enable discussions as to whether a budget increase is really needed, or if the shifts in types of crimes can be managed by re-allocating existing resources. It also perpetuates a culture of fear by highlighting only situations where reported crime rates worsened over the past year, omitting those that improved.
What did WRPS leave out?
It's important to note that in Appendix C, WRPS did not include certain types of crimes that were explicitly mentioned earlier in the memo as focus areas for hiring new officers approved through the 2022 budget. These focus areas include Break and Enter, Auto Theft, and Robbery. Despite claiming to require additional officers for these crimes, WRPS did not provide year-over-year changes for them in the memo.
Instead of directly producing results for these crimes in “Appendix C”, we can use the UCR data to fill in the gaps by assessing whether there have been consistent trends in the rate over recent years. This multi-year analysis will be more reliable than the year-over-year numbers presented in Appendix C.
Breaking and Entering
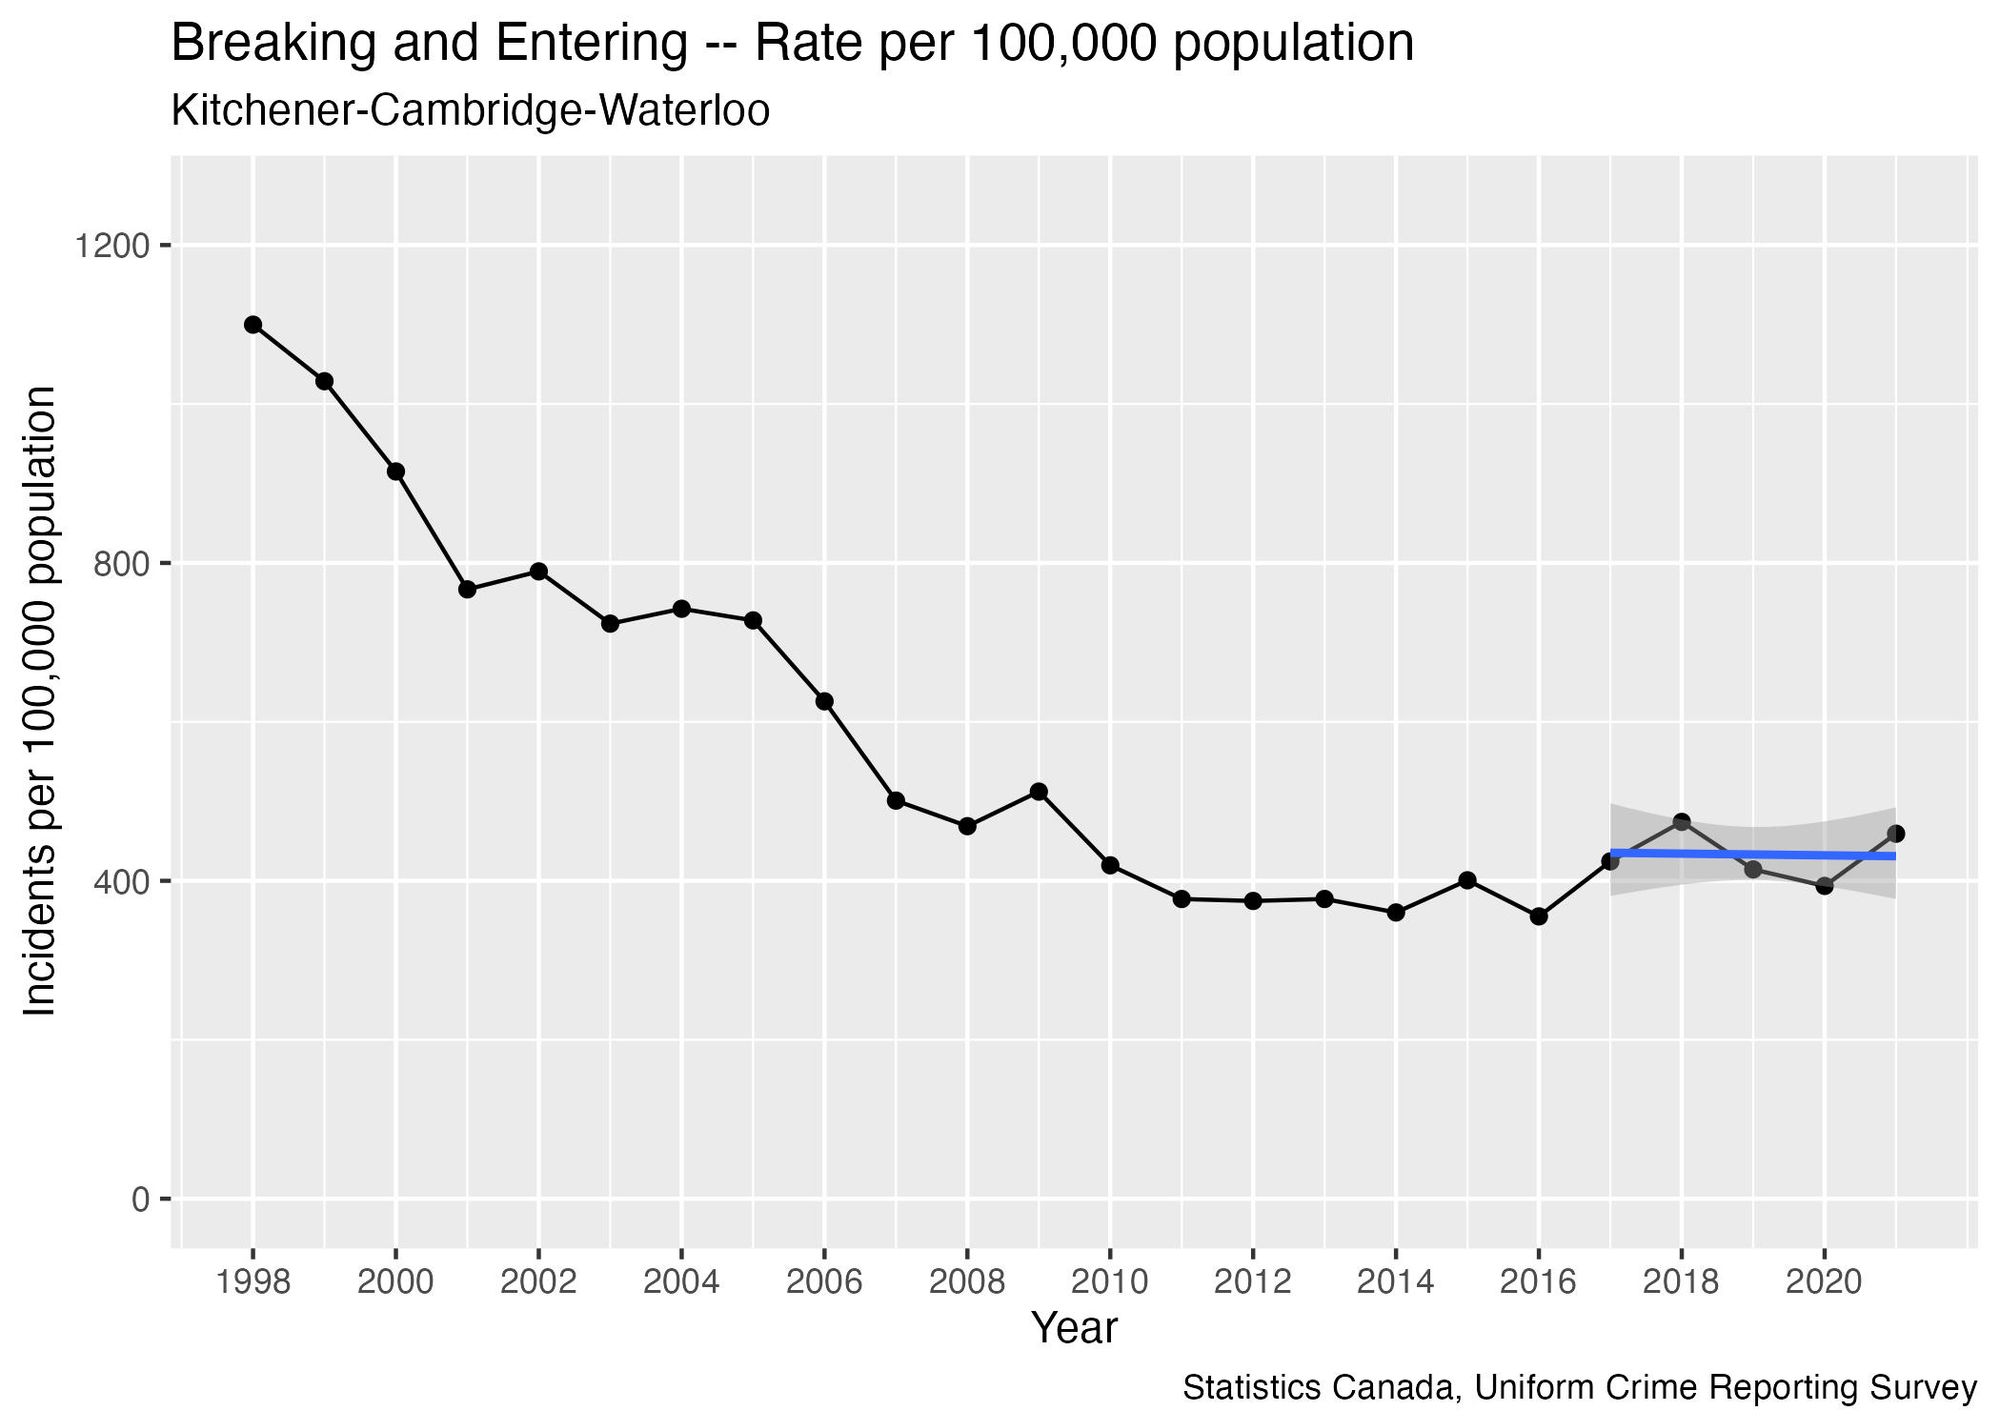
For Breaking and Entering, rates are much lower today than they were prior to 2007, suggesting that there is a long-term decreasing trend. On more recent data, it looks like the changes have flattened out around 2017:
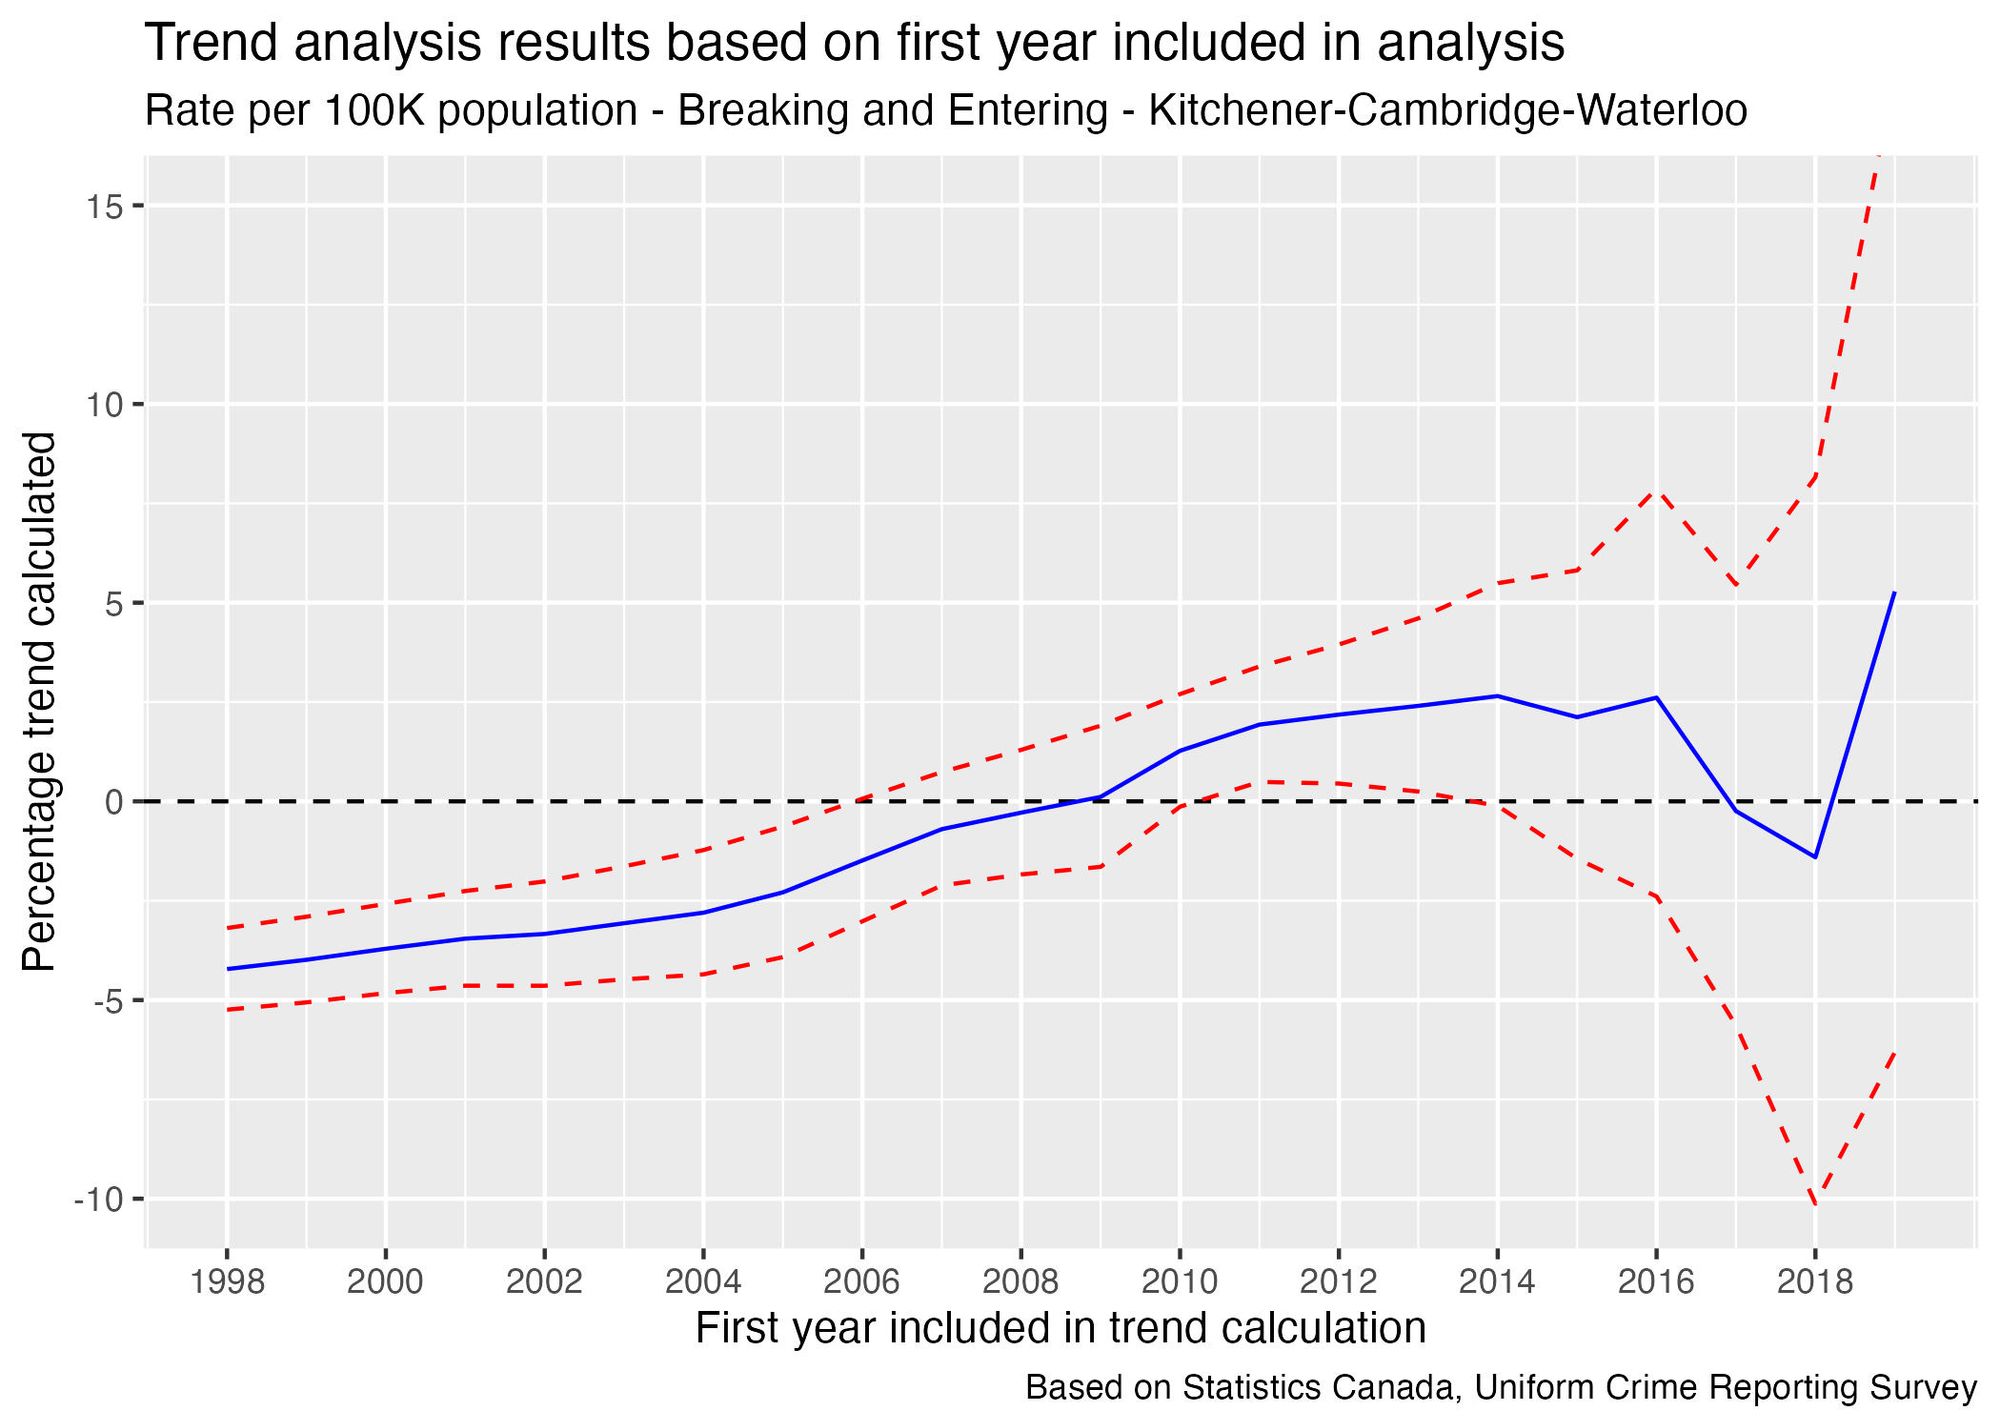
Like we saw in the issue on subjectivity in mathematical analysis, we can test how sensitive the conclusion is to my decision to start the trend line in 2017, by repeating the analysis using different starting points. In this graph, the blue line indicates the “best estimate” of the size of a trend, depending on which year is chosen as the first one to include in the analysis. The red lines convey the amount of uncertainty in the estimate:
Motor Vehicle Theft and Robbery
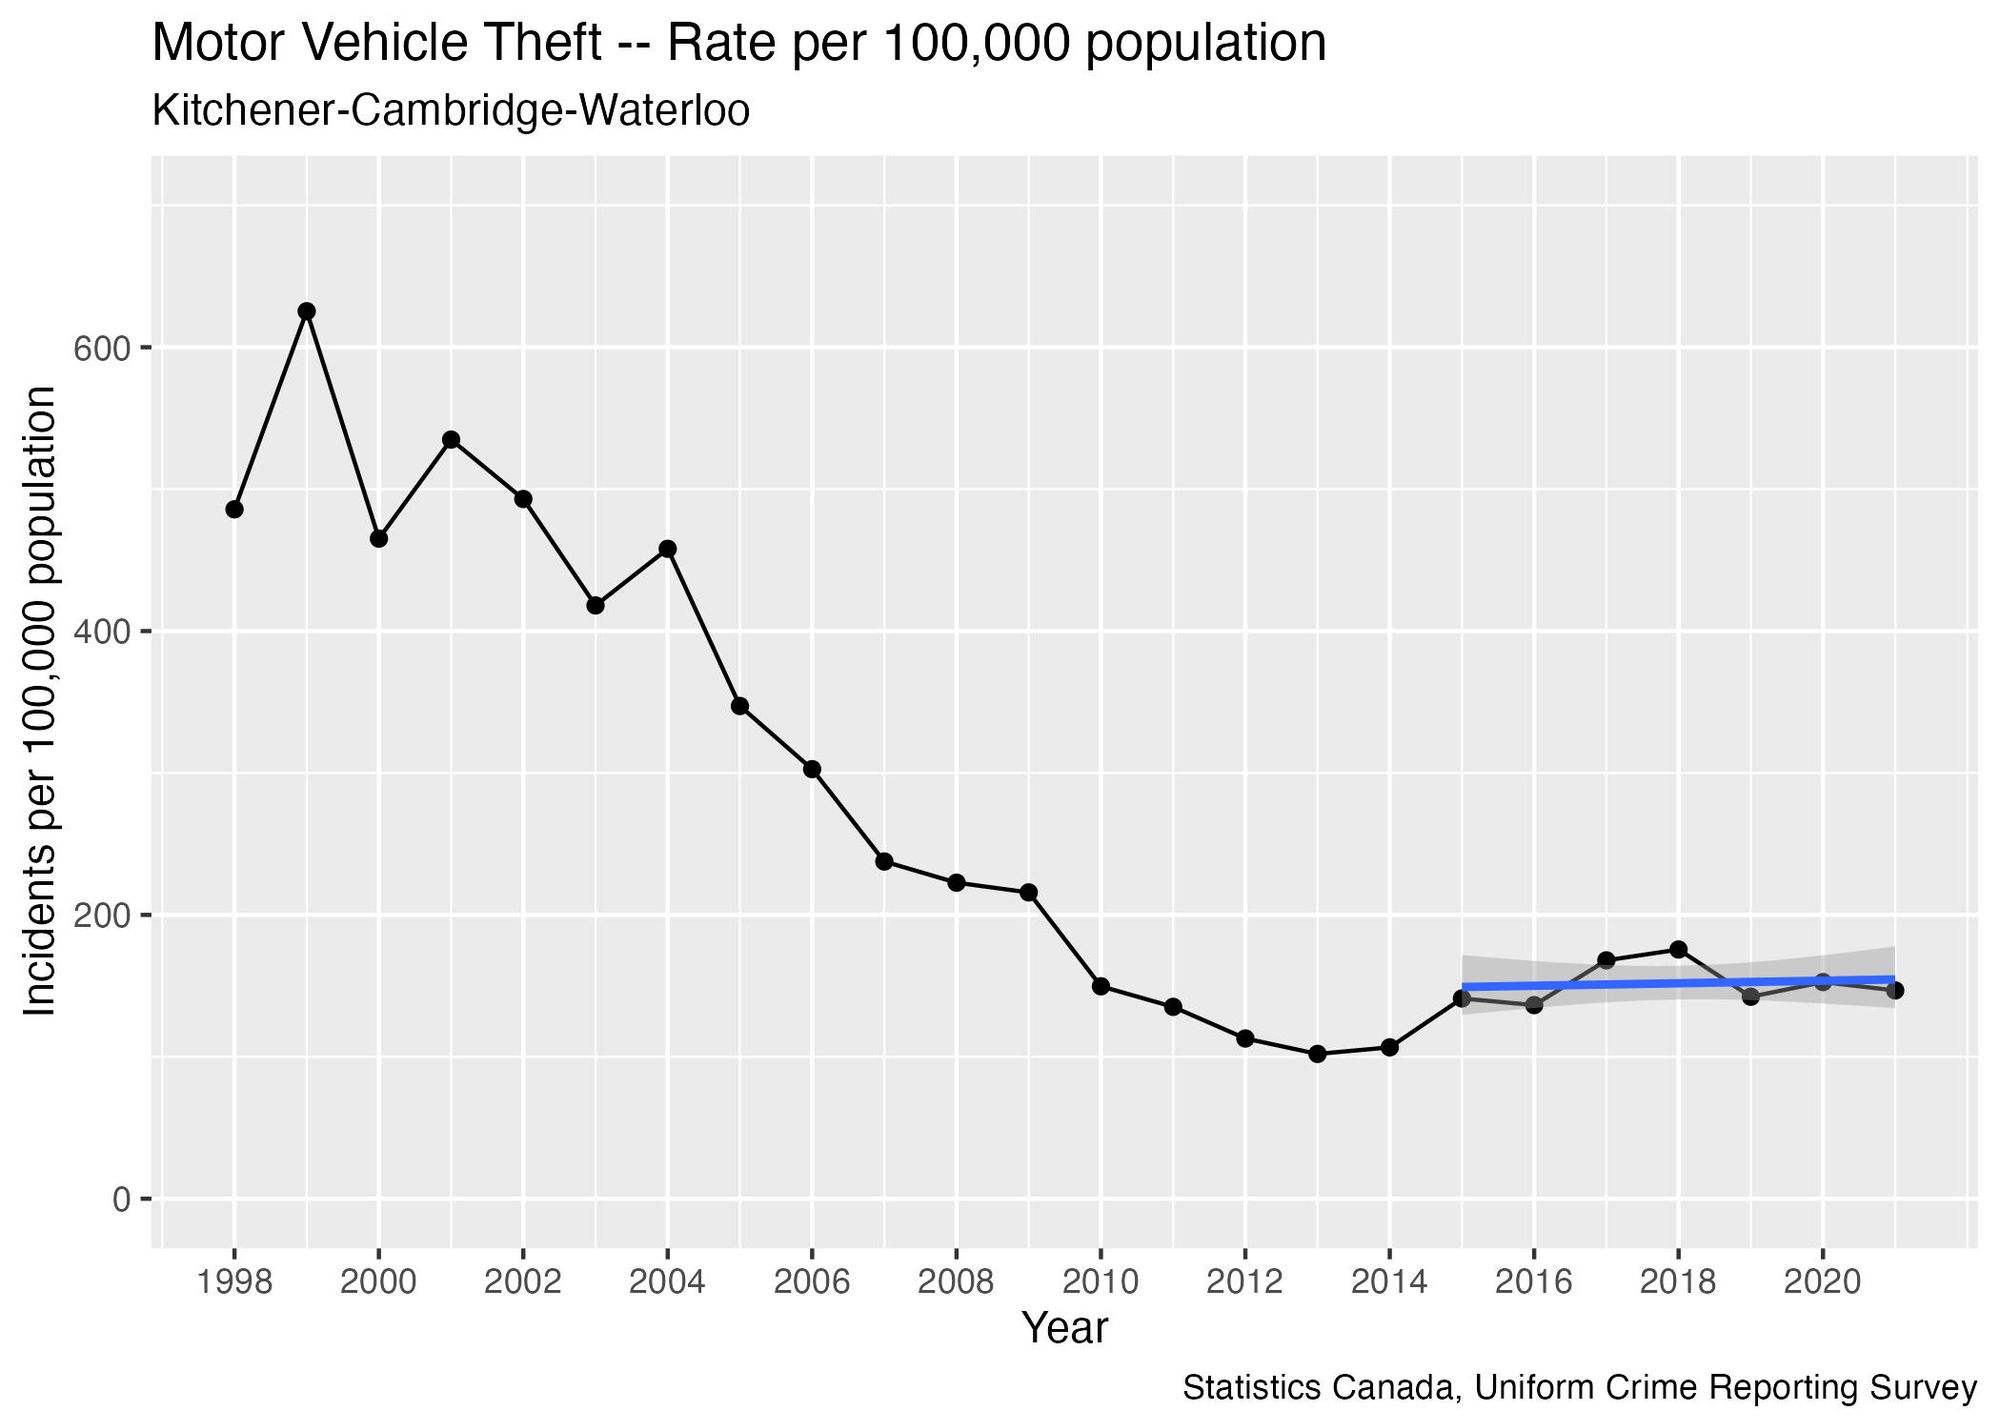
Like Breaking and Entering, Motor Vehicle Theft and Robbery both show no signs of an increasing trend. The reasoning is similar to the discussion in the preceding section, so we’ll put a short summary here and provide the details in an appendix.
Motor Vehicle Theft shows a long-term decreasing trend that has levelled off in recent years, becoming essentially flat since 2015 – based on the data going up to 2021, there is no evidence of an increasing trend. In 2022, the rate was 174, consistent with levels seen in the prior seven years, confirming that our conclusion is correct.
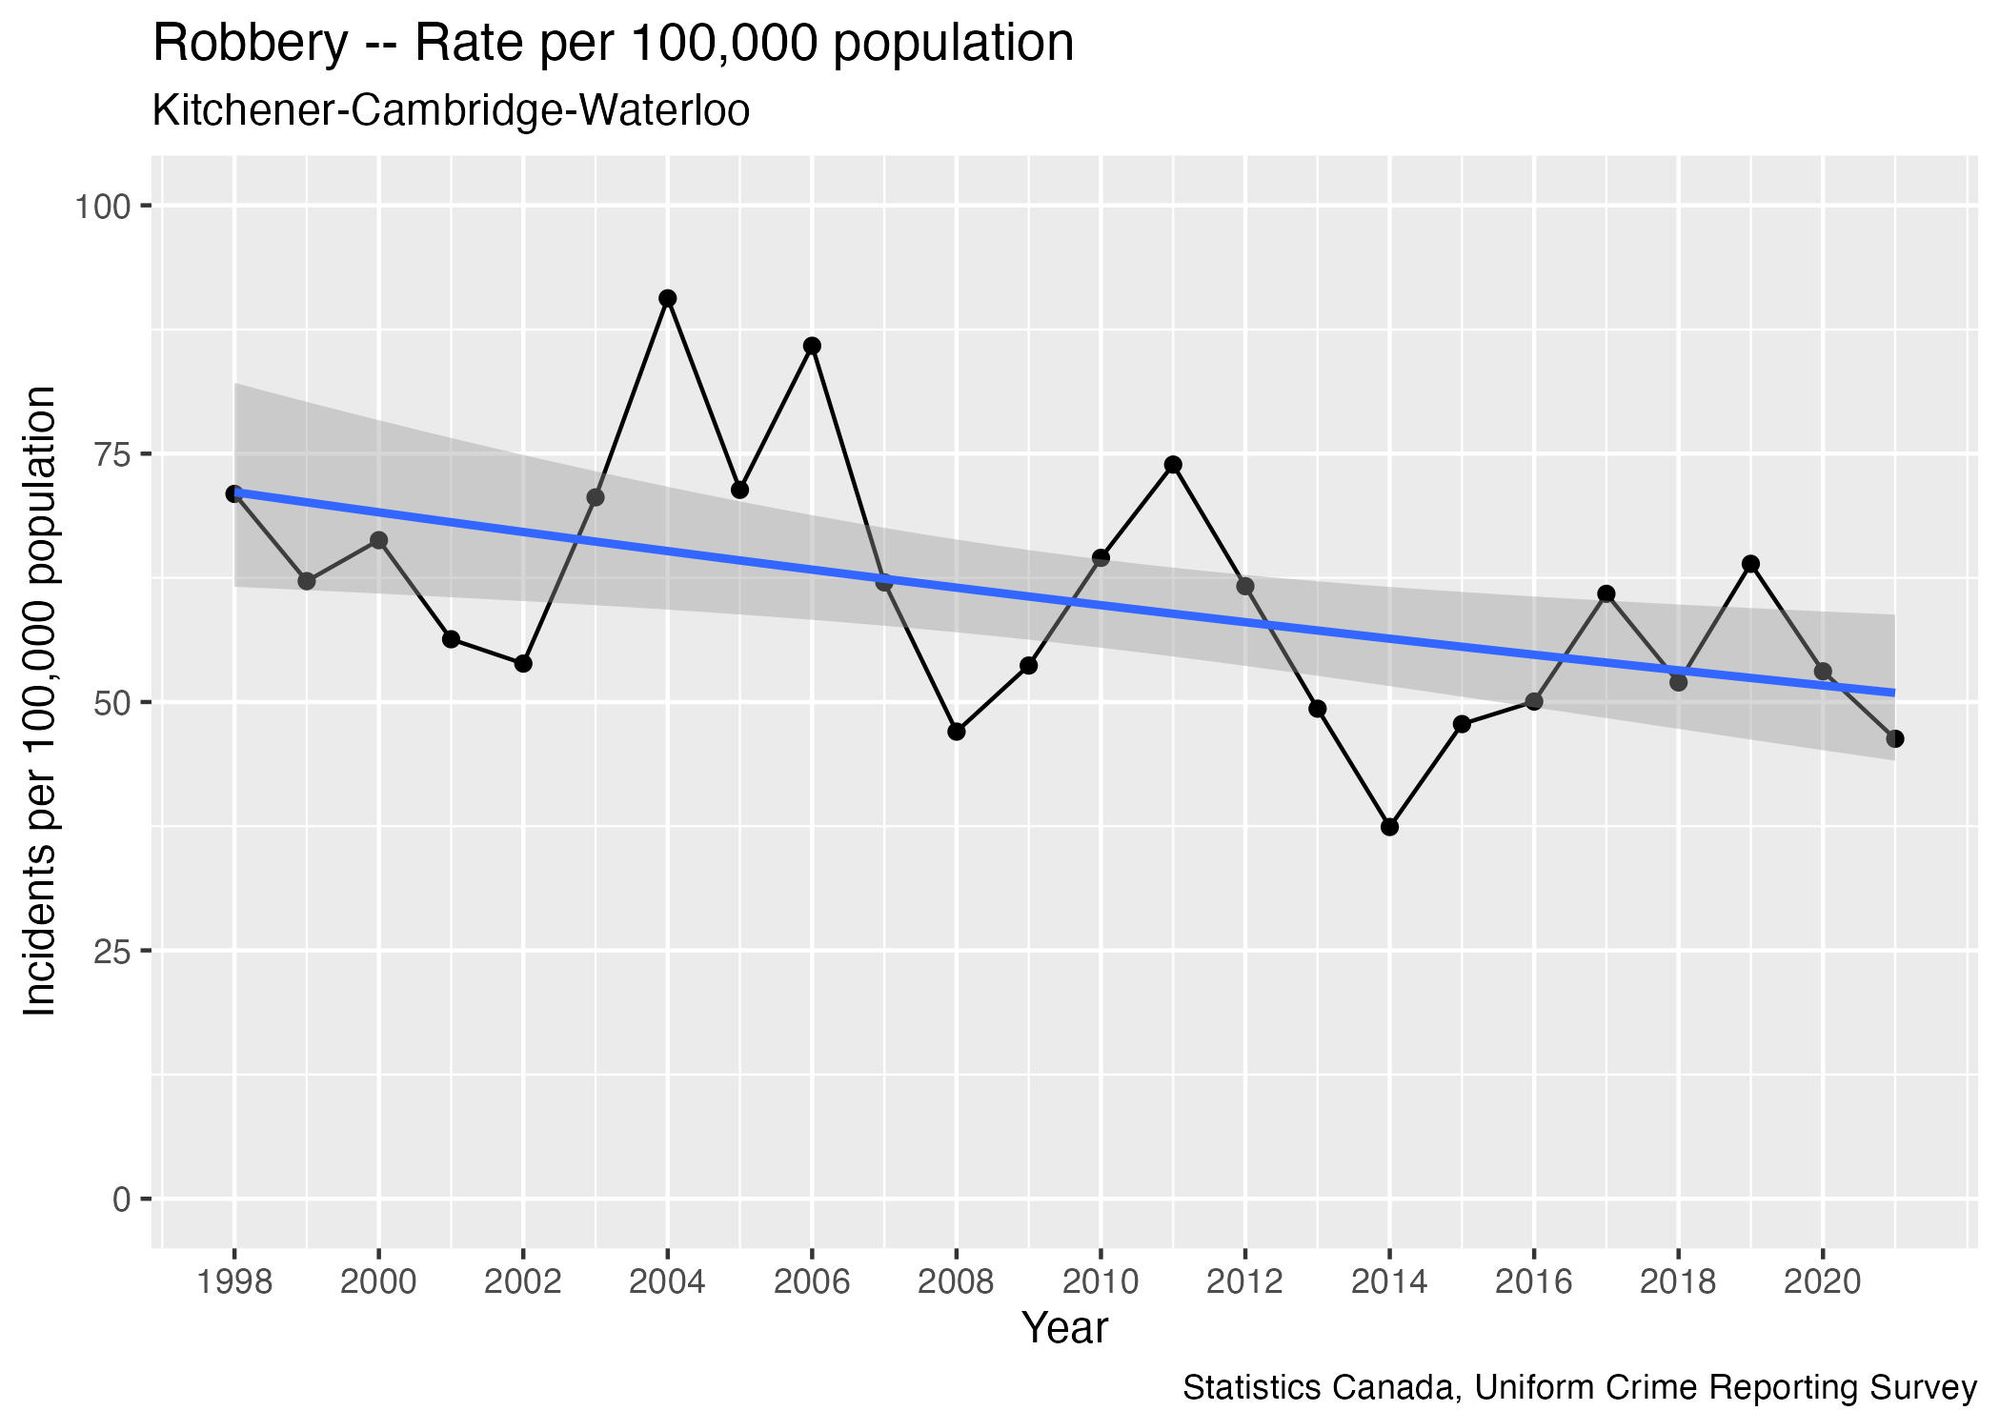
The reported rates of robberies since 1998 show significant year-over-year volatility, alternating wildly between increases and decreases. There is no evidence of an increasing trend, and a more plausible explanation is that between 1998 and 2021, this rate is just fluctuating around a flat line. This conclusion is borne out by the fact that in 2022, the rate was 61, consistent with levels seen between 2015 and 2021.
Conclusion
We’ve seen that the three types of crimes the WRPS cited as reasons for additional budget to hire more officers (i.e., breaking and entering, auto theft, and robbery) did not show upward trends leading up to 2021. These three crimes were omitted from the WRPS analysis of year-over-year changes in reported crimes between 2021 and 2022. In fact, the table showing year-over-year increases only showed examples of crimes that were increasing, and none that were decreasing, suggesting that the decision of which year-over-year statistics to include in the memo was biased in favour of creating a fear-based justification for the budget increase.
If Regional Council had more information on decreasing crimes, a natural question would be whether the police need the same level of resources for those types of crimes. Could these resources be better allocated to emerging priorities?
The next question is whether statistics like the ones in Appendix C are even relevant to the budget discussion. The budget Council votes on has high-level totals for salaries and benefits, with no transparency around the kind of activities that WRPS employees are assigned to. For example, since there’s no budget line item corresponding to Weapons Violation cases, there’s no budgetary decision that relates to year-over-year changes in the rate of this crime.
What we’ll see in the next issue is that not only is the year-over-year methodology used by WRPS incorrect and applied inconsistently, they’re not even asking the right questions.
If you’re interested in using my code to conduct your own analysis on this data, you can find it in this file on my Github repository: https://github.com/craig-sloss/questioning_the_numbers/blob/main/police_data/03_getting_the_full_picture.Rmd
This newsletter is not monetized, and we do not ask for paid subscriptions. However, if you are the sort of person who likes to pay for newsletter subscriptions, I would ask that in lieu of that you contribute to initiatives in the Waterloo Region related to social development, community activism, arts, and culture. Each month I’ll highlight an example of an initiative that I support, and invite you to join me if means permit.
This month I’d like to highlight the Social Development Centre of Waterloo Region. They play an important role in our community by providing lived experience with opportunities to be heard and incorporated into local strategies and by providing space and support for grassroots organizations to grow. They are a registered charity, and you can donate here.