Assessing Racial Bias in Waterloo Regional Police Services Intelligence Notes

Written by Craig Sloss, Edited by Fitsum Areguy
For some people, information on police surveillance and use of force can be challenging to read and have negative effects. If you’d like to connect to support and resources, click here.
The CBC recently reported that the Waterloo Regional Police Services (WRPS) had inappropriately changed the way it measures racial inequalities in its use of force cases, an approach to race-based data analysis that expert crime researchers deemed “improper, inaccurate and may set a problematic precedent."
In this article, the first in a series on data science and public policy, I’ll expose how the same change in methodology has also distorted their analysis of intelligence notes, obscuring the extent of their surveillance of racialized communities in the Waterloo Region. But before I dive into that, let me introduce myself and tell you what to expect from this newsletter.
My name is Craig Sloss, and I’m a data scientist based in Waterloo, Ontario which is situated on the Haldimand Tract, land that was promised to the Six Nations of the Grand River and traditionally and continuing to be used by Anishinaabe, Haudenosaunee, and Chonnonton peoples. I recently started following municipal politics, and soon realized that my mathematical background could provide support for discussions about issues that I cared about. My interest in applying a data science perspective to municipal issues began when I used census data to advocate for the City of Waterloo to clear snow from sidewalks in key areas, but my interest really took off when the Region of Waterloo was debating its 2023 budget.
Over the course of two weeks, I produced daily threads on Twitter debunking the deceptive statistics the WRPS were using to justify an increase to their already bloated budget. Initially, I planned to use this newsletter as a means of archiving and further exploring the ideas in those Twitter threads, but the WRPS's change to the way it measures racial inequalities is a new and pressing topic that demands our immediate attention. In future issues, I’ll return to the issues raised in those Twitter threads and continue to explore the theme of showing how data is manipulated by police to deceive the public. My objective is to equip readers with effective techniques they can use to challenge statistical claims in political contexts. I’ll be writing for a general audience, though I also realize that some readers may be interested in seeing additional technical details, so I will also include a few of these [between square brackets] – but they won’t be needed to understand the article. While I will use examples from my own city to demonstrate these ideas, I believe that the strategies and principles will be relevant to readers in other cities as well.
As a relative newcomer to this topic, I recognize that I may not know the full details or history of the topics that I’ll be discussing, but my hope is that I can provide a view on their data-related aspects that can supplement the knowledge of those who’ve been working at this far longer than I have. As a white, cis-gendered gay male, I’m fortunate to have an identity that is policed less significantly today than it was in the past. I recognize that this gives me the privilege to be able to approach, with a level of detachment, a topic that affects others much more directly than it does me. I’m also privileged to have had access to numerous education opportunities, and one of the biases resulting from my data science background is leaping first to data analysis as a way to solve a problem or convince someone of something.
By introducing a new way to analyze the race-based data they’ve been collecting, the WRPS are obfuscating their historic and ongoing disproportionate targeting of Black, Indigenous, and racialized communities in the region through intelligence gathering and use-of-force cases. The collection and analysis of race-based data will not change or lessen police surveillance or violence, and despite the changes in statistical methodology, the WRPS will remain a fundamentally racist institution.
Furthermore, the collection and reporting of this data can negatively impact communities that are already disproportionately impacted by policing. At a recent meeting of the Waterloo Regional Police Services board, the police presented data claiming that there was no evidence of racial bias in their use of police intelligence notes. However, a closer look at the report reveals that the statistics used to justify this conclusion were not calculated correctly and do not accurately measure racial bias.
Black, Middle Eastern, and Indigenous people were overrepresented in the intelligence notes, despite the statement in the report that "There was no evidence of disparate overrepresentation of racialized individuals. The number of intelligence notes for any perceived racialized group did not exceed the number of Notes involving White person subjects," which was subsequently summarized by The Record as "An analysis of the race noted in intelligence notes shows no evidence of a racial disparity."
This inaccurate analysis of the data underscores the need for more effective oversight of the statistical analysis performed by the Waterloo Regional Police Services, especially when the conclusions of this analysis are being reported through the media.
Correcting the Disparity Calculation for Intelligence Notes
The WRPS recently created a report on intelligence notes to comply with the Ontario Anti-Racism Act, which mandates that race-based data be collected and used, in accordance with Data Standards that are described in its associated regulation, for identifying and monitoring systemic racism. One of the key measures outlined in the report is Standard 29, which provides two ways of measuring racial bias: the Racial Disproportion Index and the Racial Disparity Index.
The Disproportion Index compares the percentage of intelligence notes about a specific racial group to that group’s percentage of the total population. Think of it like a pizza: if a racial group makes up 10% of the total population, then they should have 10% of the pizza. But if they only have 5% of the pizza slices (or intelligence notes, in this case), then the Disproportion Index would be 0.5. This means that the group is under-represented in the intelligence notes. On the other hand, if they have 15% of the pizza slices, then the Disproportion Index would be 1.5, indicating that they are over-represented in the intelligence notes.
The Disparity Index, also defined in Standard 29, looks at whether a group has a Disproportion Index that is higher or lower than the index for another group, called the reference group. [The technical definition is that the Disparity Index for a group is the Disproportion Index for that group, divided by the Disproportion Index for the reference group.] It can also be modified to compare other types of percentages, rates, or averages between two groups. Standard 31 specifies the White racial group as the reference group in the justice sector, meaning that the Disparity Index measures whether:
- the police make intelligence notes about a race at a higher rate than they do for White people (if the index greater than 1), or
- the police make intelligence notes about race at a lower rate than they do for White people (if the index is less than 1).
The WRPS uses a threshold of "below 0.67" to conclude under-representation and "above 1.5" to conclude over-representation, since we wouldn't generally expect either index to equal exactly 1 in most cases due to the usual "noise" in the data.
Now, let’s get to the actual numbers. The calculations of the Disparity Index that were presented by the WRPS do not match the results obtained by using the formulas from Standard 29. I’ve re-calculated the Disparity Index using the formula from Standard 29, and compared it to the version calculated by the WRPS. [For full transparency, you can find my calculations in this spreadsheet. You can see the formulas I used, and I’ve matched the numbers to the variable names used in Standard 29 to confirm that the formulas I used match up.]
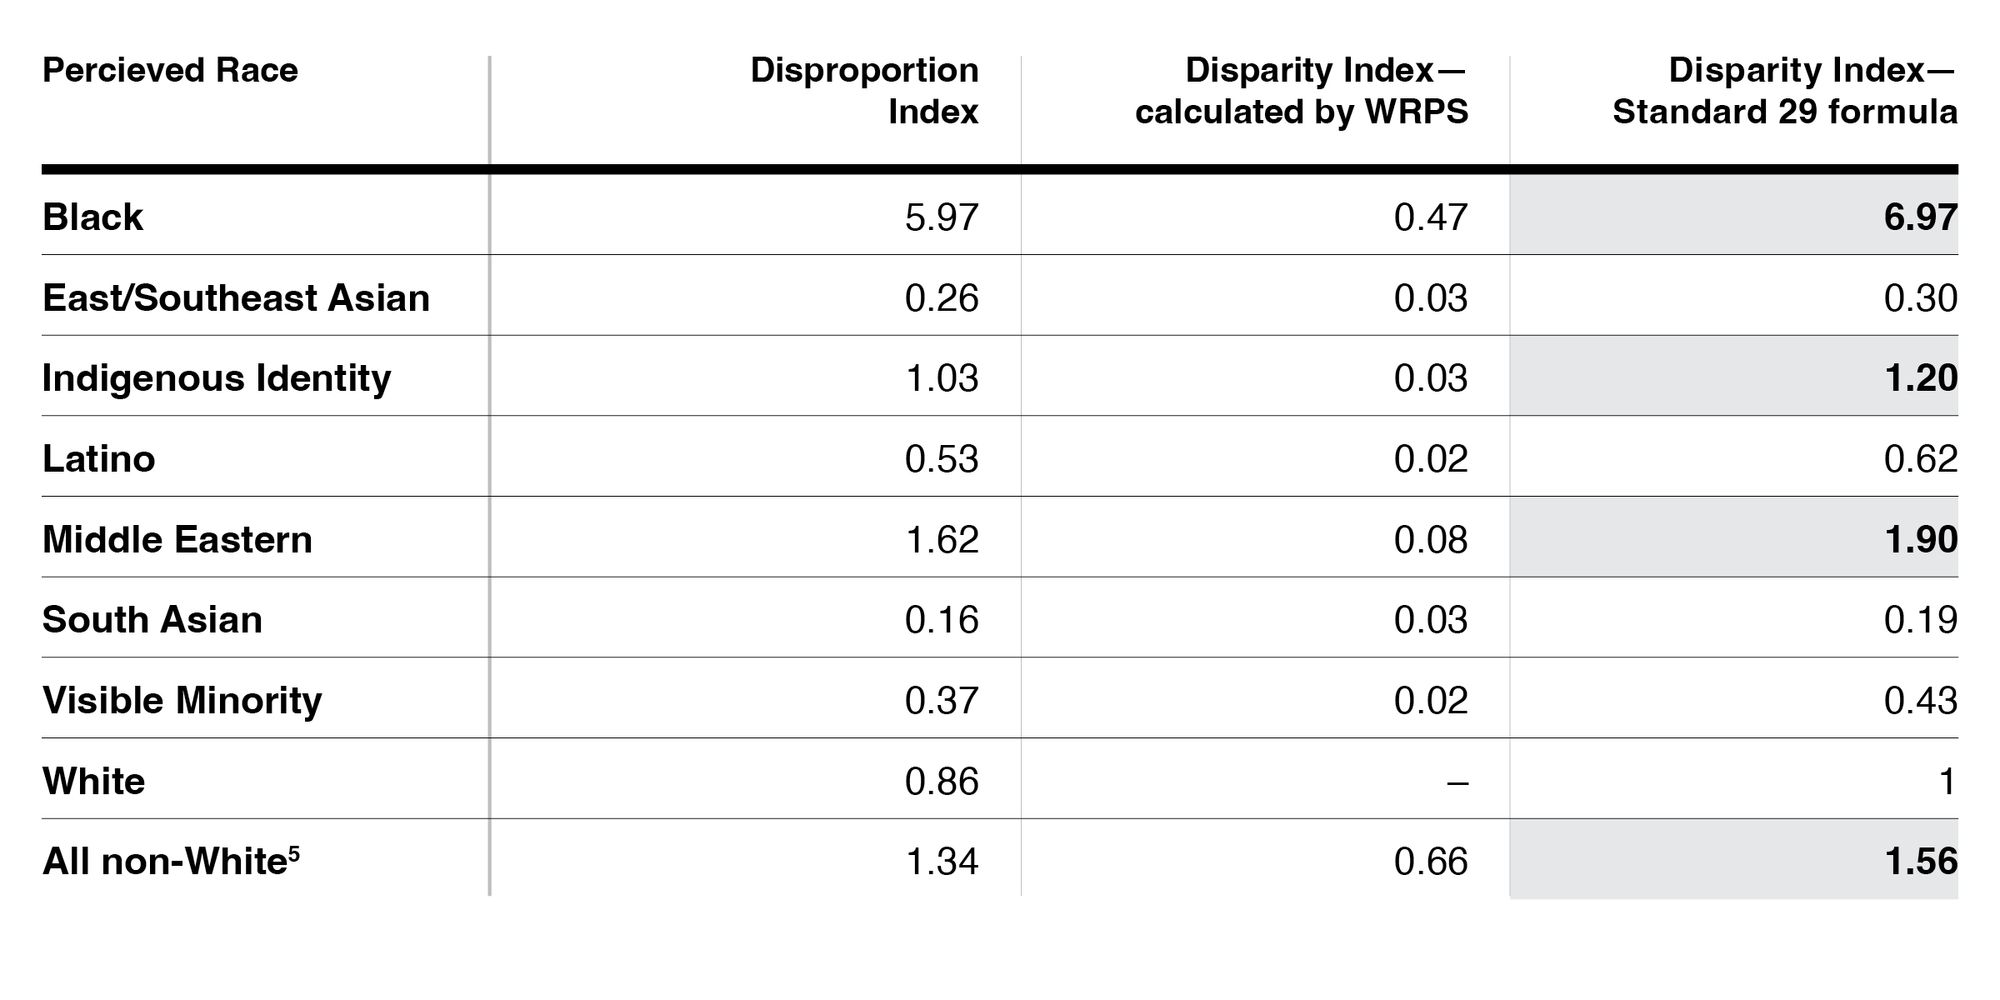
The Disparity Index calculations in the WRPS report were the justification for its claim that certain racial groups were not over-represented in the intelligence notes. The difference between the numbers presented in the WRPS report and the results obtained using the formula in Standard 29 are significant – enough so that it completely reverses the conclusion, indicating that Black, Indigenous, and Middle Eastern groups are more over-represented in the intelligence notes than the White group.
Another problem with the WRPS formula is that it is heavily influenced by the way racial categories were defined. To illustrate, I recalculated the results after combining all non-White individuals into a single group, and the WRPS version of the formula produced a result of 0.66, higher than any individual group. (To be clear, I’m not suggesting that this is an appropriate approach to use – it’s just an experiment to understand how the results change if different methodological decisions are made.) In contrast, the Disproportion Index and Standard 29 Disparity Index can produce blended results that may obscure over-representation in certain groups. A major weakness of the Disparity formula used by WRPS is that it will always produce lower results when people are split into larger numbers of racial categories. This can lead to ambiguous results – imagine that there were two groups, each with a WRPS Disparity index of 0.6. If these were combined into a single group, the index would be 1.2 – so is this one group that’s over-represented, or two groups that are under-represented? The reason this happens is because the WRPS formula does not account for the size of the groups.
Overall, the report highlights the complexity and subjectivity involved in analyzing racial disparities in intelligence notes, and underscores the need for careful consideration of methodological choices, and checking how much the results change when different methodological decisions are made.
How to Measure Racial Bias?
Measuring racial bias is a complex and multifaceted task, requiring careful consideration of the context and methodology. There are numerous ways to measure bias, each with its strengths and limitations. However, Standard 29 of the Data Standards mandates that experts and community representatives be consulted to determine which approach is appropriate for the specific circumstances. [Beyond the two approaches in Standard 29, see, for example, the Aequitas project – their “Fairness Tree” shows the methods available and provides guidance on situations in which each may be appropriate. Although they present this in the context of auditing decisions made by Machine Learning and AI models, the underlying concepts can be applied to any decision-making process.]
The Waterloo Regional Police Service's (WRPS) recent report to the Police Services Board highlights the importance of following these standards. While the WRPS consulted with academic partners, they did not mention consulting with local community groups on the use of the Disparity Index. (There are media reports of a consultation group being set up, but I haven’t found any public documentation on the outcome of these consultations.) This would have been a natural question for the Police Services Board to ask, but they did not – hearing that there has been a major shift in methodology that completely reverses the conclusion of an analysis should have triggered some additional scrutiny as to whether the change in methodology was appropriate.
The Data Standards point out one potential weakness of the Disproportionality Index, which is:
A racial disproportionality index however, does not help answer questions about whether individuals served by a [Public Service Organization] are receiving equitable treatment or outcomes in a program, service, or function.
What this is getting at is that there are really two separate questions: are people equally likely to interact with the system, and once they are in the system are they treated fairly? Using disproportionality on intelligence notes doesn’t separate these two, but it can identify whether a bias exists in the overall process. However, on its own, it can’t identify whether the bias is inherent to the process of creating intelligence notes, or whether it’s a result of greater interaction between the police and racialized groups due to over-policing. The WRPS provides a different objection to the use of disproportion: they claim that it assumes that everyone in the population has an equal chance of being included in an intelligence note, which is a reason I don’t agree with: it would be more accurate to say that disproportion measures whether everyone is equally likely to be in an intelligence note, regardless of their race, rather than making an assumption.
If we wanted to isolate the potential impact of intelligence notes on racial bias, separate from general over-policing, we could design a Disparity Index that would capture this. Standard 29 mentions that a Disparity Index can be based on a comparison of any average or rate between different groups – which further speaks to the need to consult widely on the design of the index to answer the question of which rates should be used. For intelligence notes, a natural candidate would be to ask: “among individuals about whom an intelligence note could be created, what percentage resulted in the creation of an intelligence note?” and then to compare this rate across racial groups. The problem is that we don’t have data on “individuals about whom an intelligence note could be created” so this approach isn’t practical.
The problem with the “Disparity Index” calculated by WRPS is that they did not compare rates of intelligence notes (as specified in Standard 29), but compared counts of intelligence notes. As an example, the WRPS calculated their Disparity Index for Black individuals (0.47) by dividing the number of intelligence notes about Black individuals (144) by the number of intelligence notes about White individuals (309). The WRPS explanation of their approach is unnecessarily confusing, when what they are doing just boils down to looking at two numbers and seeing which one is larger. A short thought experiment helps understand why this is the wrong approach. Imagine there was a small minority group with only 144 members in the Waterloo Region, and that every single one of them was the subject of an intelligence note. The same calculation would apply, producing a “Disparity Index” of 0.47 and a conclusion that there was “no evidence of disparate overrepresentation” for this group, despite the group being subjected to an extreme level of surveillance. This is why it’s so important that a Disparity Index be based on rates that are normalized for the sizes of the groups involved, rather than on counts. [The metric calculated by the WRPS appears to correspond to a different metric entirely, Equal Selection Parity, which tests whether there are equal numbers of members of each racial group, regardless of the group size.]
The Need for Oversight and Scrutiny
The problems associated with the WRPS conclusion around a lack of evidence of racial disparities in intelligence notes points to a broader problem with the quality of oversight being provided by the Police Services Board (PSB). When this information was presented on March 15, the board only asked two questions: the first was about whether the population data used was specific to the Region, and the second was about disparity by age groups. The PSB failed to catch significant errors in the report – errors that were big enough to completely reverse the conclusion around whether there is a racial disparity in the collection of intelligence notes.
However, having a less credulous PSB would only solve part of the problem. By the time the report is presented to the PSB, it’s already public, and can lead to the public reporting of erroneous conclusions, such as those that appeared in The Record. This points to the need to have a step that involves independent review and effective challenge of the results before they are released to the public. A pre-release review could address topics such as whether calculations are performed correctly (and in accordance with relevant standards), whether they are being interpreted correctly, and whether they provide the complete picture. Having checks like this in place would make it much less likely that erroneous results would be reported in the media in the future.